Welcome to Alameda County, Transportation Services second annual sustainability report. This report continues our commitment to environmental stewardship, transparency, and metrics oriented planning, while communicating progress to our Climate Action goals.
Over the past year, we have modernized our facilities to accommodate increased bicycle usage by employees and visitors to our offices. Many buildings lacked adequate bicycle racks. As a result, we added over 70 bicycle racks at 12 buildings and added the first fully-equipped and secured bicycle parking location for employee commuters. We also started an internal bike share for employee on-the-job travel, which we will be expanding in the next year.
We continued to lead regional collaborative fleet management initiatives. We made significant progress in the Local Government EV Fleet Demonstration Project, procuring 90 all-electric vehicles for 10 Bay Area public agencies in an effort led by Alameda County. We are also participating in a collaborative fuel procurement, which includes alternatives fuels such as biodiesel blends.
Thank you for your interest in our efforts to improve the environmental footprint of our fleet and to provide our employees and visitors with sustainable mobility options. We look forward to learning from you and other partners as we share our experiences.
We continued to lead regional collaborative fleet management initiatives. We made significant progress in the Local Government EV Fleet Demonstration Project, procuring 90 all-electric vehicles for 10 Bay Area public agencies in an effort led by Alameda County. We are also participating in a collaborative fuel procurement, which includes alternatives fuels such as biodiesel blends.
Thank you for your interest in our efforts to improve the environmental footprint of our fleet and to provide our employees and visitors with sustainable mobility options. We look forward to learning from you and other partners as we share our experiences.
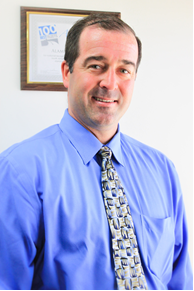
Doug Bond, Transportation Services Manager
Alameda County General Services Agency |
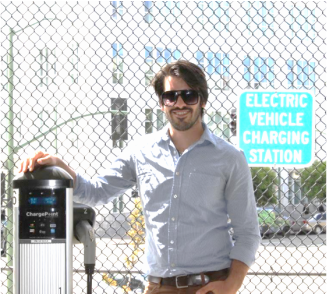
Phillip Kobernick, Sustainability Project Manager
Alameda County General Services Agency, Transportation Services |
TRANSPORTATION services overview
motor vehicle division
|
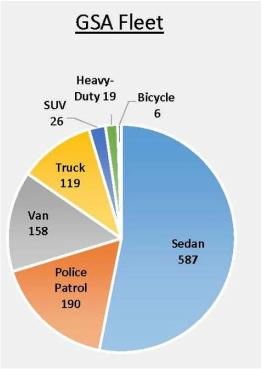
The Motor Vehicle Division operates the County’s fleet, the main mechanism for business travel. The fleet includes shared pool vehicles that are available to employees and agency-specific vehicles that are utilized to provide social services, health inspections, and law enforcement.
Fleet Facts:
|
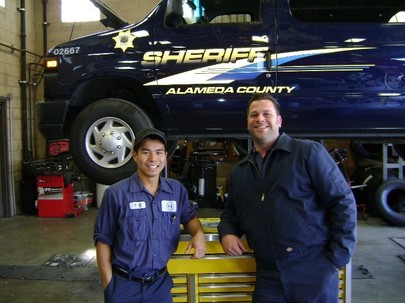
Vy Le and Kevin Barbaro, mechanics at the Dublin Motor Shop.
|
business travel alternatives

|
To reduce the County’s transportation impact, Transportation Services, in a collaborative project with the Auditor-Controller office, is leading the County’s business travel alternative initiative. This initiative produced a streamlined way for employees to check out Clipper Cards, the local inter-agency transit card, to encourage public transportation use for business travel and reduce the use of vehicles.
|
clean commute program
To address the County’s largest climate impact, employee commutes, Transportation Services launched the Clean Commute Program to encourage employees to try alternative transit modes rather than driving alone to work. Employees can now find carpools via an online carpool matching service and are now connected to regional transit through County-operated shuttles.
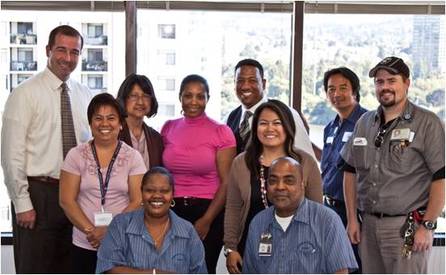
GSA staff promoting carpooling.
parking divisionAnother important division within Transportation Services is the Parking Division, which oversees 15 County-owned parking garages and lots and provides free parking to carpoolers of two or more to promote clean commuting.
|
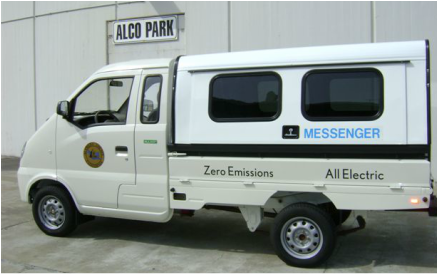
All-electric truck used by Messenger Services.
messenger servicesGSA Transportation Services also operates the Messenger Service, an intra-County mail delivery system. The Messenger Service delivers most mail to County locations the same or next day. They also collect and transport batteries for proper recycling.
|
KEY FOCUS AREAS
COMMUTING
Transportation Services is committed to advancing the goals of Alameda County’s Climate Action Plan for Government Services and Operations (CAP). The slideshow below highlights the department’s sustainability strategies, as well past and future actions related to the Climate Action Plan. To read the full CAP, visit http://www.acgov.org/sustain/next/plan.htm.
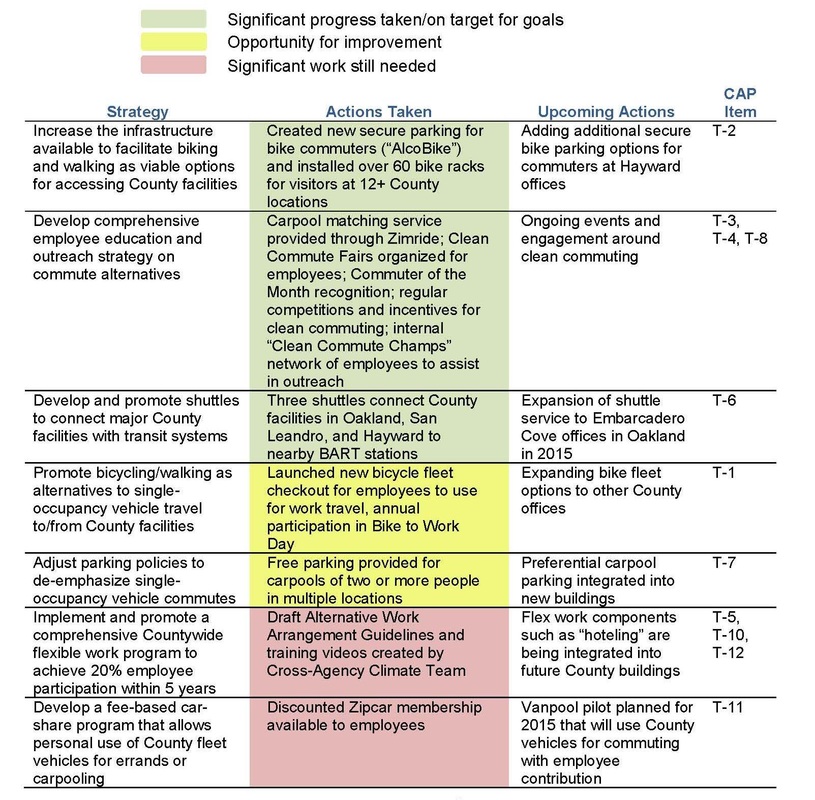
key focus areas
green fleet
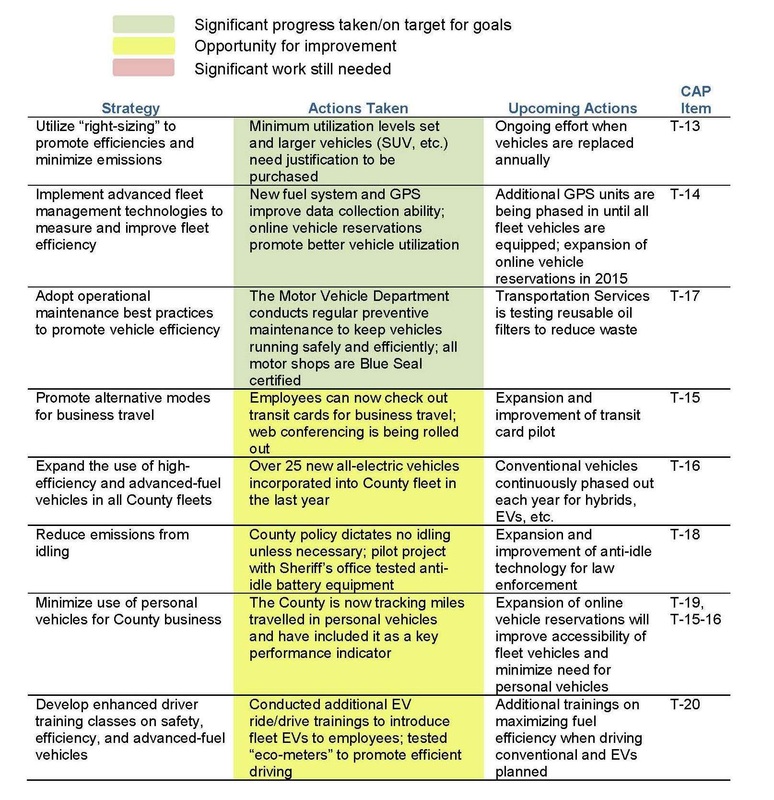
driving sustainability in 2013-2014
|
Embracing Electric Vehicles
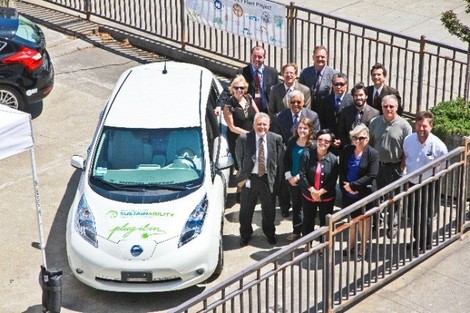
Alameda County is leading the Local Government EV Fleet Demonstration project, a collaboration of 10 Bay Area public agencies and the Bay Area Climate Collaborative, to purchase 90 EVs and charging stations for local fleets. The County led the largest municipal purchase of EVs in the County, achieving competitive pricing for the Nissan Leaf, Ford Focus EV, and Zenith electric cargo van. |
|
Improving Bicycle Infrastructure
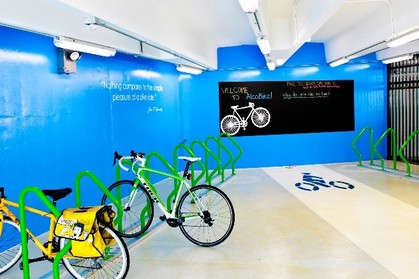
Making County facilities more conducive for bicyclists was a major focus in the past year. Through funding from the Air District, we added over 75 bicycle racks at a dozen County facilities, including 6 libraries. To address shortages of secure parking options for bicycles, GSA, in collaboration with the Alameda County Arts Commission, converted an unused area of a parking garage into a secure location for employee bicycle commuters (called “AlcoBike”). 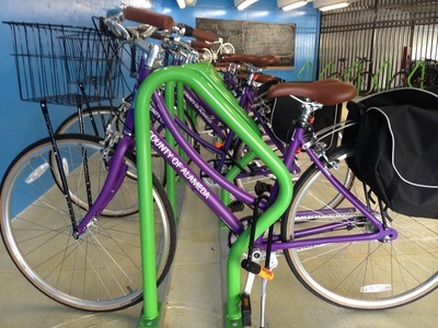
|
Creating a New Bicycle Fleet The last year saw the newest addition into the County fleet, bicycles. Six new bicycles were added to the County vehicle pool for employees to use for on the job travel and plans are underway for internal expansion. |
|
Clean Commute Champions To help spread the word on clean commuting , GSA created a new network of Clean Commute Champions, who serve as a resource for their colleagues and encourage the use of alternative commute modes. The “Champs” helped on-board new employees and promote the County’s participation in the Great Race for Clean Air. |

|
Great Race for Clean Air
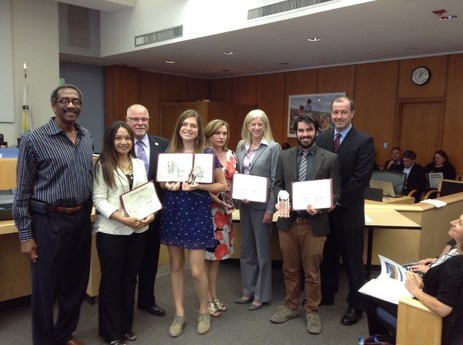
Last year, Alameda County participated in the Great Race for Clean Air, a regional competition among Bay Area employers, organized by 511 and the Bay Area Air Quality Management District. Hundreds of employees participated and the County earned 1st place in overall CO2 emissions reductions.
The horizon.
reducing grid pressure from evs
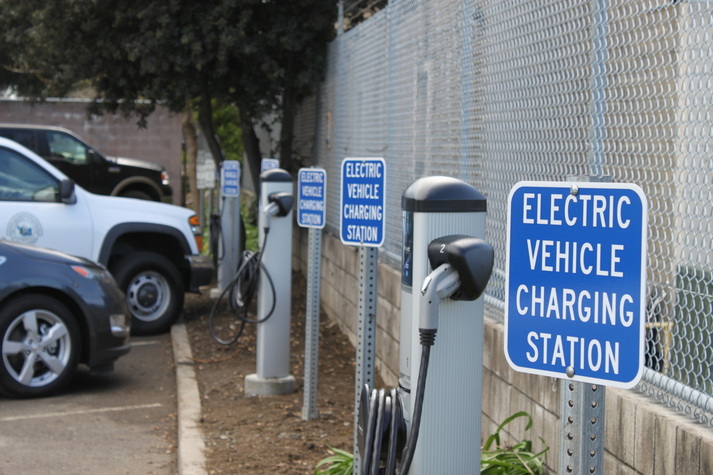
With the expansion of EVs in Alameda County’s fleet to over 50 vehicles, the AlcoPark operations center has doubled in energy demand. To mitigate the expense of additional electrical loads, the County is exploring options that reduce demand from charging stations and exploring the use of battery systems that store energy and reduce stress on the grid.
expanding online vehicle reservations
Transportation Services is making it easier for County employees to access fleet vehicles by expanding online vehicle reservations for County departments and agencies. Reducing the need for personal vehicle use saves the County from reimbursement processing and also supports clean commuting.
Expanding commuter Engagement
The Clean Commute Champions campaign was a successful utilization of highly motivated employees to help spread the word on clean commuting resources and initiatives to their colleagues. The program will be expanded to more departments and agencies in the coming year.
tracking progress
Making progress begins with measurement and tracking. Below is a summary of the key performance indicators that we use to track progress.
37,000. Gallons of gasoline saved over the past two years through efficient and electric vehicles.
22 MPG. The average fuel efficiency of all vehicles, excluding law-enforcement.
22 MPG. The average fuel efficiency of all vehicles, excluding law-enforcement.
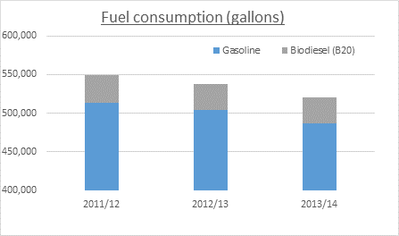
FY 2011/2012 FY 2012/2013 FY 2013/14 Gasoline 513,346 503,823 486,659 Biodiesel (B20) 36,19 33,823 34,279 |
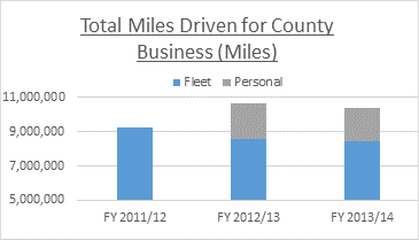
FY 2012/13 FYI 2013/14
Fleet Vehicles 8,595,158 8,398,571 Personal Vehicles 2,034,036† 1,938,484 † Estimated. Alameda County began tracking this specific metric in January 2013.
|
|
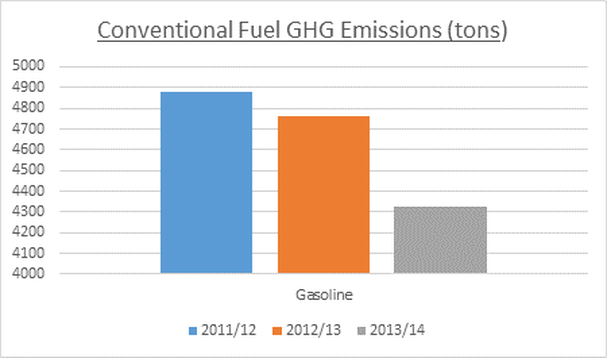
FY 2013/14
GHG emissions (tons) 4,326** ** Based on total gasoline consumption and EPA’s Simplified GHG Emissions Calculator. Future years will incorporate additional fuels such as electricity. |
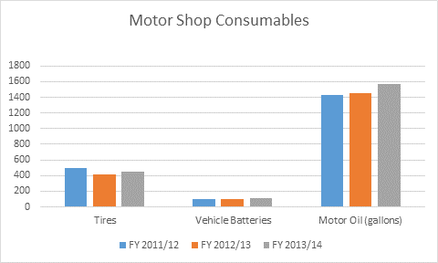
FY 2011/12 FY 2012/13 FY 2013/14
Tires 495 418 453 Vehicle Batteries 103 104 108 Motor Oil (gallons) 1430 1451 1564 |
ACHIEVEMENTS
2014
BAY AREA ELECTRIC VEHICLE READINESS AWARD,
Large Community, Bay Area Climate Collaborative and Silicon Valley Leadership Group
2014
100 BEST FLEETS IN NORTH AMERICA,
Governing Magazine
2013/2012/2011/2010/2009
100 BEST FLEETS IN NORTH AMERICA,
Government Fleet Magazine
2014/2013/2012/2011/2010/2009
TOP 40 GOVERNMENT GREEN FLEET,
Green Fleet Magazine
2014/2013/2012/2011
SUSTAINABILITY ALL-STAR,
Green Fleet Magazine
Transportation Services Manager, Doug Bond
2014 1ST PLACE OVERALL CO2 EMISSIONS REDUCTIONS,
Great Race for Clean Air
2014
BAY AREA ELECTRIC VEHICLE READINESS AWARD,
Large Community, Bay Area Climate Collaborative and Silicon Valley Leadership Group
2014
100 BEST FLEETS IN NORTH AMERICA,
Governing Magazine
2013/2012/2011/2010/2009
100 BEST FLEETS IN NORTH AMERICA,
Government Fleet Magazine
2014/2013/2012/2011/2010/2009
TOP 40 GOVERNMENT GREEN FLEET,
Green Fleet Magazine
2014/2013/2012/2011
SUSTAINABILITY ALL-STAR,
Green Fleet Magazine
Transportation Services Manager, Doug Bond
2014 1ST PLACE OVERALL CO2 EMISSIONS REDUCTIONS,
Great Race for Clean Air